Русскоязычный заголовок: Об индексах потребительских цен на товары и услуги в Малайзии (январь - март 2010 г.)
Щодо індексів споживчих цін на товари та послуги в Малайзії
(січень - березень 2010 р.) (англ.)
Consumer Price Index Malaysia March 2010 (Updated : 23/04/2010)
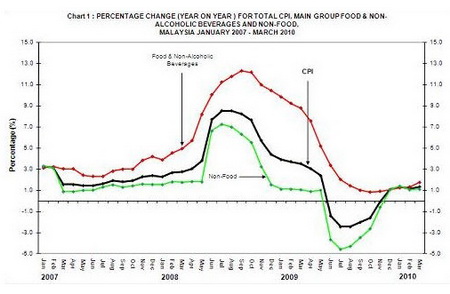
The Consumer Price Index (CPI) for the period January to March 2010 increased by 1.3 per cent to 113.2 compared with that of 111.8 in the same period last year. When compared to the same month in 2009, the CPI for March 2010 registered an increase of 1.3 per cent from 111.7 to 113.2 and compared with the previous month, the CPI remain unchanged at 113.2.
The index for Food & Non-Alcoholic Beverages and Non-Food for the month of March 2010 compared to the same month in 2009 showed an increase of 1.7 per cent and 1.1 per cent respectively. For the period January to March 2010, the index for Food & Non-Alcoholic Beverages and Non-Food increased by 1.4 per cent and 1.2 per cent respectively. Compared to the previous month, the index for Non-Food increased by 0.1 per cent while the index for Food & Non-Alcoholic Beverages decreased by 0.1 per cent (Table 1).
CPI changes for the period January - March 2010 / 2009
The 1.3 per cent increase in the CPI was brought about by increases observed in the indices of all the main groups except those of Clothing & Footwear ( - 1.5 per cent ) and Communication ( - 0.4 per cent ). Notable increases among these main groups with high weights were Food & Non-Alcoholic Beverages ( + 1.4 per cent ); Housing, Water, Electricity, Gas & Other Fuels ( + 1.0 per cent ) and Transport ( + 0.7 per cent ). Other increases were Miscellaneous Goods & Services ( + 3.1 per cent ); Alcoholic Beverages & Tobacco ( + 2.9 per cent ); Recreation Services & Culture ( + 2.7 per cent ); Education ( + 1.7 per cent ); Health and Restaurants & Hotels by 1.5 per cent respectively and Furnishings, Household Equipment & Routine Household Maintenance ( + 0.7 per cent ).
Table 1 : CONSUMER PRICE INDEX FOR MAIN GROUPS, MALAYSIA (2005=100)
|
Group
|
Wt.
|
Index
|
% Change
|
|
Mar
2009
|
Feb
2010
|
Mar
2010
|
Jan - Mar
2009
|
Jan - Mar
2010
|
Mar 2010 /
Feb 2010
|
Mar 2010 /
Mar 2009
|
Jan - Mar
2010 / 2009
|
|
TOTAL
|
100.0
|
111.7
|
113.2
|
113.2
|
111.8
|
113.2
|
0.0
|
1.3
|
1.3
|
|
Food & Non-Alcoholic Beverages
|
31.4
|
120.3
|
122.5
|
122.4
|
120.7
|
122.4
|
-0.1
|
1.7
|
1.4
|
|
Alcoholic Beverages & Tobacco
|
1.9
|
130.2
|
134.0
|
134.1
|
130.2
|
134.0
|
0.1
|
3.0
|
2.9
|
|
Clothing and Footwear
|
3.1
|
96.0
|
94.6
|
94.5
|
96.2
|
94.8
|
-0.1
|
-1.6
|
-1.5
|
|
Housing, Water, Electricity, Gas & Other Fuels
|
21.4
|
105.4
|
106.5
|
106.5
|
105.4
|
106.5
|
0.0
|
1.0
|
1.0
|
|
Furnishings, Household Equip. & Routine Household Maintenance
|
4.3
|
108.2
|
108.8
|
109.0
|
108.1
|
108.9
|
0.2
|
0.7
|
0.7
|
|
Health
|
1.4
|
107.8
|
109.4
|
109.3
|
107.7
|
109.3
|
-0.1
|
1.4
|
1.5
|
|
Transport
|
15.9
|
111.9
|
112.8
|
112.7
|
111.9
|
112.7
|
-0.1
|
0.7
|
0.7
|
|
Communication
|
5.1
|
96.4
|
96.1
|
96.0
|
96.5
|
96.1
|
-0.1
|
-0.4
|
-0.4
|
|
Recreation Services & Culture
|
4.6
|
104.4
|
107.2
|
107.2
|
104.4
|
107.2
|
0.0
|
2.7
|
2.7
|
|
Education
|
1.9
|
108.1
|
109.8
|
110.0
|
108.0
|
109.8
|
0.2
|
1.8
|
1.7
|
|
Restaurants and Hotels
|
3.0
|
117.6
|
119.2
|
119.6
|
117.4
|
119.2
|
0.3
|
1.7
|
1.5
|
|
Miscellaneous Goods & Services
|
6.0
|
110.2
|
112.8
|
112.8
|
109.5
|
112.9
|
0.0
|
2.4
|
3.1
|
|
Non-Food
|
68.6
|
107.8
|
108.9
|
109.0
|
107.7
|
109.0
|
0.1
|
1.1
|
1.2
|
|
Durable Goods
|
8.0
|
100.0
|
100.6
|
100.5
|
99.5
|
100.6
|
-0.1
|
0.5
|
1.1
|
|
Semi-Durable Goods
|
4.3
|
98.0
|
97.0
|
96.9
|
98.2
|
97.2
|
-0.1
|
-1.1
|
-1.0
|
|
Non-Durable Goods
|
40.6
|
116.9
|
118.6
|
118.5
|
117.3
|
118.6
|
-0.1
|
1.4
|
1.1
|
|
Services
|
47.1
|
110.3
|
112.0
|
112.1
|
110.2
|
112.0
|
0.1
|
1.6
|
1.6
|
Based on the above changes and the weights assigned to the main groups, the relative contribution to the overall increase of 1.3 per cent in the CPI can be identified as shown in Table 2. The three main groups, Food & Non-Alcoholic Beverages; Housing, Water, Electricity, Gas & Other Fuels and Transport together accounted for 65.3 per cent of the overall increase recorded for the current period.
Table 2 : CONTRIBUTION TO THE CHANGES IN THE OVERALL CONSUMER PRICE INDEX BY MAIN GROUPS, MALAYSIA (2005=100)
|
Group
|
Wt.
|
2009 / 2008
|
March
2010 / 2009
|
January - March
2010 / 2009
|
|
% Change
|
% Contribution
|
% Change
|
% Contribution
|
% Change
|
% Contribution
|
|
TOTAL
|
100.0
|
0.6
|
100.0
|
1.3
|
100.0
|
1.3
|
100.0
|
|
Food & Non-Alcoholic Beverages
|
31.4
|
4.1
|
199.7
|
1.7
|
45.5
|
1.4
|
39.1
|
|
Alcoholic Beverages & Tobacco
|
1.9
|
6.1
|
18.8
|
3.0
|
5.0
|
2.9
|
5.3
|
|
Clothing and Footwear
|
3.1
|
-0.9
|
-3.8
|
-1.6
|
-3.1
|
-1.5
|
-3.2
|
|
Housing, Water, Electricity, Gas & Other Fuels
|
21.4
|
1.4
|
41.1
|
1.0
|
16.2
|
1.0
|
17.2
|
|
Furnishings, Household Equip. & Routine Household Maintenance
|
4.3
|
2.9
|
18.0
|
0.7
|
2.2
|
0.7
|
2.3
|
|
Health
|
1.4
|
2.3
|
4.3
|
1.4
|
1.5
|
1.5
|
1.6
|
|
Transport
|
15.9
|
-9.4
|
-234.7
|
0.7
|
8.4
|
0.7
|
9.0
|
|
Communication
|
5.1
|
-0.5
|
-3.6
|
-0.4
|
-1.5
|
-0.4
|
-1.5
|
|
Recreation Services & Culture
|
4.6
|
1.5
|
10.1
|
2.7
|
9.0
|
2.7
|
9.2
|
|
Education
|
1.9
|
2.4
|
6.2
|
1.8
|
2.4
|
1.7
|
2.5
|
|
Restaurants and Hotels
|
3.0
|
2.9
|
13.2
|
1.7
|
4.1
|
1.5
|
4.0
|
|
Miscellaneous Goods & Services
|
6.0
|
3.8
|
30.7
|
2.4
|
10.3
|
3.1
|
14.5
|
The 1.4 per cent increase in the index for Food & Non-Alcoholic Beverages was the result of increases for Food At Home ( + 1.1 per cent ); Food Away From Home ( + 2.1 per cent ) and Coffee, Tea, Cocoa & Non-Alcoholic Beverages ( + 0.5 per cent ). Among the subgroups of Food At Home which showed significant increases during this period were Sugar, Jam, Honey, Chocolate and Confectionery ( + 7.3 per cent ); Fruits ( + 1.8 per cent ); Meat ( + 1.5 per cent ); Fish & Seafood ( + 1.5 per cent ); Vegetables ( + 1.0 per cent ) and Rice, Bread & Other Cereals ( + 0.6 per cent ).
Table 3 : CONSUMER PRICE INDEX FOR SUB-GROUPS OF FOOD AND NON-ALCOHOLIC BEVERAGES, MALAYSIA (2005=100)
|
Sub-group
|
Wt.
|
Index
|
% Change
|
|
Mar
2009
|
Feb
2010
|
Mar
2010
|
Jan - Mar
2009
|
Jan - Mar
2010
|
Mar 2010 /
Feb 2010
|
Mar 2010 /
Mar 2009
|
Jan - Mar
2010 / 2009
|
|
Food & Non-Alcoholic Beverages
|
31.4
|
120.3
|
122.5
|
122.4
|
120.7
|
122.4
|
-0.1
|
1.7
|
1.4
|
|
Food
|
30.0
|
120.7
|
122.9
|
122.8
|
121.1
|
122.8
|
-0.1
|
1.7
|
1.4
|
|
Food At Home
|
19.6
|
121.1
|
123.3
|
123.1
|
121.8
|
123.2
|
-0.2
|
1.7
|
1.1
|
|
Rice, Bread & Other Cereals
|
4.6
|
127.9
|
128.7
|
128.8
|
127.9
|
128.7
|
0.1
|
0.7
|
0.6
|
|
Meat
|
2.9
|
116.0
|
117.8
|
118.4
|
116.2
|
117.9
|
0.5
|
2.1
|
1.5
|
|
Fish & Seafood
|
4.5
|
125.1
|
129.0
|
127.8
|
126.7
|
128.6
|
-0.9
|
2.2
|
1.5
|
|
Milk, Cheese & Eggs
|
1.8
|
121.6
|
119.9
|
119.8
|
123.0
|
120.4
|
-0.1
|
-1.5
|
-2.1
|
|
Oils and Fats
|
0.6
|
104.3
|
103.9
|
103.9
|
104.2
|
103.9
|
0.0
|
-0.4
|
-0.3
|
|
Fruits
|
1.4
|
112.3
|
113.4
|
113.8
|
111.4
|
113.4
|
0.4
|
1.3
|
1.8
|
|
Vegetables
|
2.3
|
122.9
|
126.7
|
126.4
|
125.3
|
126.6
|
-0.2
|
2.8
|
1.0
|
|
Sugar, Jam, Honey, Choc. &
Confectionery
|
0.7
|
105.9
|
113.5
|
113.5
|
105.8
|
113.5
|
0.0
|
7.2
|
7.3
|
|
Food Products n.e.c.
|
0.8
|
114.1
|
118.8
|
119.4
|
114.4
|
118.9
|
0.5
|
4.6
|
3.9
|
|
Food Away From Home
|
10.4
|
119.9
|
122.1
|
122.4
|
119.6
|
122.1
|
0.2
|
2.1
|
2.1
|
|
Coffee, Tea, Cocoa & Non-Alcoholic Beverages
|
1.4
|
113.2
|
113.7
|
114.1
|
113.2
|
113.8
|
0.4
|
0.8
|
0.5
|
Monthly Changes for CPI
Compared with the previous month, the CPI for March 2010 remain unchanged at 113.2. Increases were shown in four main groups namely Restaurants & Hotels ( + 0.3 per cent ); Furnishings, Household Equipment & Routine Household Maintenance and Education by 0.2 per cent respectively; Alcoholic Beverages & Tobacco ( + 0.1 per cent ). On the other hand, decreases were shown for Food & Non-Alcoholic Beverages; Clothing & Footwear; Health; Transport and Communication by 0.1 per cent respectively. Indices for Housing, Water, Electricity, Gas & Other Fuels; Recreation Services & Culture and Miscellaneous Goods & Services remain unchanged at 106.5; 107.2 and 112.8 respectively.
The 0.1 per cent decrease in the index for Food & Non-Alcoholic Beverages in March 2010 compared with that of the previous month was the result of decrease in the index for Food At Home by 0.2 per cent while the index for Food Away From Home and Coffee, Tea, Cocoa & Non-Alcoholic Beverages were increased by 0.2 per cent and 0.4 per cent respectively.
Among the food items which recorded notable increases in the index in March 2010 compared with the previous month were Cucumber ( + 16.0 per cent ); Apples, Green ( + 3.8 per cent ); Kailan ( + 3.4 per cent ); Choy Sum ( + 3.0 per cent ); Round Scad (Fish) ( + 1.3 per cent ) and Chicken ( + 0.7 per cent ).
Meanwhile, the index of some food items decreased in March 2010 compared with the previous month. Among these were Tomatoes ( - 19.3 per cent ); Red Chillies ( - 8.4 per cent ); Onions, Big ( - 7.2 per cent ); Honeydew ( - 3.8 per cent ); Brinjals ( - 3.7 per cent ); Indian Mackerel (Fish) ( - 2.1 per cent ) and Cuttlefish ( - 1.9 per cent ).
A reclassification of items according to their durability and services rendered showed an increase of 0.1 per cent for Services. Indices for Semi-Durable Goods; Durable Goods and Non-Durable Goods decreased by 0.1 per cent respectively.
| 

 Малайзія